Data-Driven Growth: Why Startup Founders Can’t Afford to Ignore Their Metrics
In today’s hyper-competitive ecosystem, intuition is no longer enough to steer a startup toward success. While creativity and vision ignite an idea, data-driven startup growth keeps it alive. The startups that thrive in 2025 and beyond are those that understand — and act upon — their numbers. From tracking monthly recurring revenue to measuring churn and acquisition cost, startup growth metrics have become the lifeblood of informed decision-making and sustainable scaling.
In fact, according to Harvard Business Review, startups that consistently leverage data outperform their competitors by over 20% in growth rate and operational efficiency. Data isn’t just an advantage — it’s a survival tool.
The Data-Driven Mindset for Modern Founders
Modern founders are not just visionaries; they are scientists of their own growth. Every successful growth stage startup is built upon a foundation of measurable insight — a system of feedback loops that tell founders what’s working and what’s not. Gone are the days when progress was gauged by investor interest or social buzz. In the era of digital transparency, it’s the metrics that tell the truth.
For example, a high-growth startup might rely on dashboards that visualise customer acquisition cost (CAC), conversion funnels, or lifetime value (LTV). These dashboards give real-time clarity on how the business performs and where to adjust strategies. By contrast, early-stage founders who ignore these indicators often waste valuable capital on untested ideas or inefficient campaigns.
This data-driven culture allows founders to scale lean, iterating quickly based on hard evidence rather than assumption — scaling lean mastering the key metrics for startup growth isn’t just a catchphrase, it’s a proven methodology. It enables teams to prioritise initiatives with the highest ROI, eliminate waste, and focus efforts where real traction exists.
At EmporionSoft Pvt Ltd, this principle underpins the way digital transformation projects are built. From software development services to intelligent analytics dashboards, the company empowers founders to visualise their key metrics in actionable ways, ensuring decisions are backed by insight rather than instinct.
From Gut Feelings to Growth Metrics: A Shift in Strategy
The most defining shift in the startup ecosystem has been the move from intuition-led to data-driven startup growth. A decade ago, “gut feeling” guided product pivots, hiring decisions, and marketing spend. Today, data has become the central nervous system of every successful business strategy.
Consider the difference between two startups at the same funding stage. One uses real-time dashboards that track retention and CAC:LTV ratios; the other relies on qualitative impressions from sales calls. Over time, the first startup learns exactly when to adjust pricing or refine its acquisition channels, while the second keeps guessing — often reacting too late. The result? The data-informed company experiences exponential growth, while the other stagnates or collapses.
This evolution mirrors the Lean Startup methodology, where experimentation replaces assumption. When applied effectively, it enables founders to identify “north star metrics” — the single measure that best captures their company’s long-term success. For SaaS startups, this could be active subscribers per month; for marketplaces, gross transaction volume; for mobile apps, user retention rate.
But true innovation happens when metrics are connected — when founders integrate product analytics, customer feedback, and financial KPIs into one coherent picture. That’s where modern platforms and analytics engineering come in. By implementing tailored growth dashboards through providers like EmporionSoft, founders can centralise their operational insights and make faster, more strategic moves.
Why Metrics Matter More Than Ever
In the current climate, every decision must prove its worth. Startups can no longer afford to rely on optimism or market buzz — they must operate with measurable precision. Understanding startup growth metrics not only helps founders validate their startup growth strategy but also aligns their teams around common objectives. Engineers, marketers, and product managers can all read the same data and work towards the same goals, eliminating silos and miscommunication.
Moreover, investors increasingly demand clarity in numbers. A founder who can confidently discuss churn reduction, CAC optimisation, or MRR growth signals maturity and control — traits that attract funding. This is where data becomes storytelling: a transparent narrative of progress and potential.
Startups that master their metrics don’t just survive; they scale smarter, faster, and stronger. They learn that growth isn’t about doing more — it’s about doing better. And with the right analytics foundation in place, doing better becomes a matter of clarity, not chance.
Understanding the Four Stages of Startup Growth: From Idea to Maturity
Every successful startup follows a recognisable path — from its fragile beginnings to becoming a scalable, mature business. Yet, the secret to surviving this journey lies not in ambition alone but in understanding the stages of startup growth and the metrics that guide each phase. Founders who align their goals with measurable outcomes at every stage build stronger, leaner, and more adaptable companies that can navigate uncertainty with confidence.
A Startup Genome study found that nearly 70% of startups fail due to premature scaling, often because they focus on the wrong indicators too early. Recognising where your startup truly stands in its business cycle — from startup growth, establishment, expansion to maturity — is therefore crucial to achieving long-term sustainability.
The Four Stages of Startup Growth Explained
Every company begins as an idea — but how it transforms into a revenue-generating entity depends on how effectively it moves through four fundamental stages of growth. Each stage demands distinct key performance indicators (KPIs) to measure progress, guide decision-making, and prevent costly missteps.
1. Pre-Startup Stage: Ideation and Validation
This is where the vision forms. Founders focus on identifying market needs, building prototypes, and testing their assumptions. The key here is validation, not profit.
Metrics at this stage include:
-
Problem–solution fit (Are you solving a real problem?)
-
Customer discovery metrics (survey participation, sign-ups, pilot engagement)
-
Prototype engagement rate
The goal is to avoid building something nobody wants. For early innovators, focusing on early stage startup growth means prioritising feedback over revenue.
2. Establishment Stage: Product-Market Fit and Early Traction
Once a viable product exists, the next challenge is proving people will pay for it. This phase is where many founders face their first scaling temptation. Instead, focus shifts toward traction.
Essential KPIs include:
-
Customer acquisition cost (CAC)
-
Monthly recurring revenue (MRR)
-
Activation and retention rates
Here, sustainable progress depends on validating repeatable growth channels. A startup that understands its startup company growth rate at this stage can make data-driven investments in marketing and operations rather than relying on guesswork.
3. Expansion Stage: Scaling Operations and Markets
After achieving consistent product-market fit, startups enter expansion mode — often characterised by rising customer demand and funding inflows. However, expansion must be strategic. Over-hiring or over-spending can sink momentum.
Metrics include:
-
Revenue growth rate (month-over-month or year-over-year)
-
Customer lifetime value (LTV)
-
Market share increase
-
Churn rate
Founders should benchmark themselves against industry standards and competitors, maintaining efficiency while increasing output. Strategic agility, as explored in Adaptive Software Development, becomes essential here — helping teams evolve their technology and processes to meet scaling demands.
4. Maturity Stage: Optimisation and Diversification
At maturity, the startup stabilises into a full-fledged business. Focus shifts from aggressive expansion to optimisation, profitability, and innovation.
Metrics include:
-
Net promoter score (NPS)
-
Profit margins and EBITDA
-
Operational efficiency ratio
A mature company now aims for startup sustainable growth — continuous innovation without destabilising its core. Mature startups may also explore diversification into new products or verticals while maintaining consistent customer satisfaction.
Aligning Metrics with Your Growth Stage
One of the most common traps in entrepreneurship is tracking the wrong KPIs for your stage of growth. A pre-seed founder obsessing over revenue, or a scaling company ignoring churn, can easily derail progress. For example, during the establishment stage, CAC and retention are far more critical than profit margin; meanwhile, a mature business must focus on efficiency and long-term value.
Understanding this alignment ensures that decision-making stays relevant and data-driven. It also strengthens communication with investors, who value transparency and stage-appropriate benchmarks.
At EmporionSoft Pvt Ltd, we apply this principle when helping startups design bespoke data ecosystems and performance dashboards. Our case studies showcase how founders across industries leveraged accurate stage-based metrics to identify bottlenecks, improve scalability, and achieve predictable revenue growth.
From Early-Stage Startup Growth to Hyper Growth Startup
Moving from early-stage validation to hyper-growth scaling isn’t a linear process — it’s a series of informed transitions. The fastest-growing startups are those that respect each stage’s metrics before advancing to the next. They evolve from testing hypotheses to building repeatable systems and, finally, to automating processes for efficiency.
Hyper-growth startups, particularly in SaaS and tech sectors, often demonstrate “hockey-stick” expansion — exponential gains following a long plateau of experimentation. But this trajectory is never random. It’s the byproduct of consistent tracking, agile adaptation, and continuous refinement of KPIs at every level.
Founders who master this discipline create resilient organisations capable of navigating shifts in technology, customer behaviour, and market competition. They understand that startup growth is not about speed but precision — knowing when to scale and what to measure.
Financial Foundations: The KPIs Every Founder Must Master for Sustainable Startup Growth
Behind every successful pitch deck, funding round, and scaling decision lies a deep understanding of numbers that matter. While vision attracts investors, financial KPIs define credibility. Founders who can clearly explain their Monthly Recurring Revenue (MRR), Customer Acquisition Cost (CAC), Lifetime Value (LTV), Gross Margin, and Runway stand apart as data-literate leaders ready for scalable success.
These metrics aren’t mere accounting figures — they’re strategic growth signals. They show how efficiently your business converts resources into revenue, how sustainable your model is, and whether you’re ready to enter a new growth phase. As Investopedia notes, mastering these indicators helps startups “transform uncertainty into measurable opportunity.”
Decoding MRR, CAC, and LTV
At the heart of modern startup finance are three interlinked KPIs: MRR, CAC, and LTV. They form the backbone of any credible growth analysis.
Monthly Recurring Revenue (MRR)
MRR measures the predictable income your business generates each month — particularly vital for SaaS and subscription-based models.
Formula:
MRR = Total Number of Paying Customers × Average Revenue per Customer
For instance, if you have 500 active users paying £20 per month, your MRR is £10,000. Tracking this consistently helps determine whether your growth model for startup is moving towards stability or volatility. A steadily rising MRR signals solid retention and market traction.
Customer Acquisition Cost (CAC)
CAC tells you how much you spend to acquire one paying customer.
Formula:
CAC = Total Sales and Marketing Spend ÷ Number of New Customers Acquired
A high CAC relative to revenue means your marketing strategy is inefficient or unsustainable. Reducing CAC through optimised funnels or automation increases profitability and investor appeal.
Lifetime Value (LTV)
LTV estimates the total revenue you can expect from a customer throughout their relationship with your business.
Formula:
LTV = Average Purchase Value × Purchase Frequency × Customer Lifespan
When comparing LTV vs CAC, investors look for at least a 3:1 ratio — meaning each customer generates three times the value of their acquisition cost. This balance indicates your startup is on the right path to profitability and scalability.
By integrating these KPIs into real-time dashboards — such as those built using EmporionSoft’s data-driven software solutions — founders gain clarity on growth velocity, campaign ROI, and unit economics without drowning in spreadsheets.
Profitability Metrics That Predict Growth
Beyond acquisition and retention, profitability metrics reveal the health and sustainability of your business. These determine how efficiently your startup converts sales into actual profit.
Gross Margin
This metric shows how much revenue remains after subtracting the direct costs of producing goods or services.
Formula:
Gross Margin (%) = [(Revenue – Cost of Goods Sold) ÷ Revenue] × 100
A high gross margin indicates a scalable model with room for reinvestment. For software startups, margins typically exceed 70–80%, while hardware or logistics startups may operate between 30–50%, depending on startup growth rate by industry.
Cash Burn and Runway
Runway represents how long your startup can operate before running out of cash.
Formula:
Runway = Current Cash ÷ Monthly Net Burn Rate
If your company burns £20,000 per month and has £120,000 in reserve, your runway is six months. Founders who know their runway can plan fundraising and expansion more strategically — avoiding the trap of scaling without safety.
Break-Even Point
The break-even point defines when total revenue equals total costs. Startups reaching this point early demonstrate operational maturity and attract investors seeking stability.
These profitability metrics connect directly with investor confidence. Venture capital firms such as Sequoia Capital often use them as benchmarks when assessing startup scalability and future funding potential.
The Startup Growth Rate Calculator: Turning Data into Decisions
Growth isn’t guesswork — it’s measurable. Understanding how to calculate growth rate for startup performance allows founders to see whether their trajectory aligns with expectations.
Formula:
Growth Rate (%) = [(Current Period Revenue – Previous Period Revenue) ÷ Previous Period Revenue] × 100
For example, if your revenue increased from £50,000 to £65,000 month-over-month, your growth rate is 30%. Monitoring this trend over time provides insight into momentum, seasonality, and overall market fit.
Average Growth Rate of Startups
Industry data suggests that early-stage SaaS startups typically experience 15–25% month-over-month growth during the first two years, while hardware and retail startups may grow slower, around 5–10% depending on capital intensity. Comparing your numbers against these benchmarks helps assess whether your startup growth plan examples are realistic or overly ambitious.
At EmporionSoft Pvt Ltd, growth analytics are embedded into scalable data ecosystems. By leveraging advanced insights through solutions like Harnessing the Power of Data Lakes, founders can centralise and visualise these metrics across departments — from finance to marketing — ensuring that each decision contributes directly to measurable progress.
From Numbers to Narrative
Ultimately, these KPIs transform your startup’s financial data into a growth story investors understand. A founder who can articulate how MRR trends, CAC efficiency, and runway projections work together doesn’t just demonstrate business literacy — they build credibility and trust.
Beyond the Numbers: Operational and Customer Metrics That Drive Sustainable Startup Growth
While financial indicators reveal how efficiently a startup earns money, operational and customer metrics show how long it can keep earning it. Many founders obsess over vanity figures such as downloads or followers, but true growth comes from how effectively users engage, stay, and advocate for your product.
By analysing churn rate, retention, Net Promoter Score (NPS), activation rate, and product engagement, startups gain insight into customer satisfaction, experience quality, and long-term viability. These are the real pillars behind every hockey stick growth startup — the kind of exponential curve every founder dreams of achieving.
According to Bain & Company, a 5% increase in retention can boost profits by 25–95%. That’s not a marketing tactic — it’s a strategy for survival.
The Role of Churn Rate in Sustainable Growth
If revenue is the oxygen of a startup, churn is the leak in the tank. Churn rate measures the percentage of customers who stop using a product or service over a given time. It’s one of the most revealing yet underappreciated metrics in early scaling.
Formula:
Churn Rate = (Customers Lost During Period ÷ Total Customers at Start of Period) × 100
A low churn rate signals strong product-market fit, while a high churn rate indicates friction — poor onboarding, weak value proposition, or lack of product evolution.
For example, a SaaS startup with 1,000 active users that loses 50 in a month has a churn rate of 5%, which might be acceptable in early stages but devastating during expansion. Founders should view churn not as a failure metric but as an opportunity for refinement. Analysing why users leave helps uncover weak points in customer experience or pricing structure.
Forward-thinking teams often deploy growth hacking tools for startups to automate churn analysis. Machine learning models can predict at-risk customers based on usage frequency or declining engagement. By integrating such real-time analytics — similar to the methods showcased in Real-Time AI in Production — startups can intervene before churn occurs, turning potential losses into recoveries.
Sustainable growth isn’t about endlessly acquiring new customers; it’s about retaining the ones you already have.
Customer Retention and Lifetime Value Connection
Customer retention is the heartbeat of a growth-oriented startup business. It reflects your ability to maintain long-term relationships and continuously deliver value. A retained customer costs less to serve and often spends more over time, directly influencing Lifetime Value (LTV).
Formula:
Retention Rate = [(Total Customers at End – New Customers During Period) ÷ Total Customers at Start] × 100
When retention strengthens, LTV naturally increases, reducing dependence on constant acquisition and stabilising revenue. This creates a virtuous cycle where customer satisfaction fuels profitability — the hallmark of sustainable startup growth.
Beyond numbers, retention reflects emotional loyalty. This is where Net Promoter Score (NPS) becomes indispensable. NPS gauges how likely customers are to recommend your product to others — a strong indicator of organic growth potential.
Formula:
NPS = % Promoters – % Detractors
As HubSpot notes, companies with higher NPS scores grow at more than twice the rate of competitors. Tracking this regularly allows founders to see if their value proposition truly resonates or if product promises fall short.
High retention and strong NPS combined create a compounding growth effect — where each satisfied customer attracts more, accelerating network-driven expansion. This foundation supports the kind of compounding curve seen in growth startups bootcamp agenda sessions: small, consistent wins that turn into exponential scale.
User Experience as a Growth Engine
A great product isn’t just one that works — it’s one that users love to engage with. Activation rate and product engagement metrics reveal how intuitively customers adopt and interact with a product after signup or first use.
Activation Rate
Activation marks the point when users experience the product’s “aha moment.” For a project management tool, it might be when a user creates their first task; for a streaming app, when they watch their first video.
Formula:
Activation Rate = (Number of Activated Users ÷ Total Sign-Ups) × 100
Higher activation rates indicate a smooth onboarding flow and clear value delivery. A drop here suggests complexity or poor UX, areas ripe for improvement through growth hacking strategies for startup success.
Product Engagement
This measures how frequently and deeply users interact with the product — through daily usage, feature adoption, or time spent. Consistent engagement leads to retention, advocacy, and upselling potential.
Companies achieving hockey stick growth startup curves typically have one thing in common: continuous user engagement improvements based on behaviour-driven data. Startups can leverage A/B testing, feedback loops, and behavioural analytics to uncover what drives satisfaction.
At EmporionSoft Pvt Ltd, these insights inform digital innovation across industries. Through advanced analytics and adaptive software development principles explored in The Software Developer’s Roadmap 2025, EmporionSoft helps founders build user-centric systems that turn engagement into enduring loyalty.
Beyond Vanity Metrics
Metrics like social media followers or app installs may look impressive but rarely correlate with actual business growth. Operational and customer metrics — churn, retention, activation, NPS — reveal whether users find lasting value. These indicators transform a product from being “downloaded” to being lived with.
In essence, growth hacking isn’t about shortcuts; it’s about understanding what truly drives user success and sustainable revenue. Founders who focus on these deeper metrics don’t just achieve growth — they achieve longevity.
Building a Data Infrastructure: Turning Startup Growth Metrics into Actionable Intelligence
In the modern digital ecosystem, data is the new fuel, but without the right infrastructure, it’s just untapped potential. Startups that succeed in today’s competitive markets don’t merely collect information — they transform it into insight. A reliable data infrastructure enables founders to visualise their startup growth metrics in real time, spot inefficiencies, and make faster, smarter decisions.
This is where business intelligence (BI) tools, AI-driven analytics, and data pipelines come together to form the growth engine of a modern startup. Platforms like EmporionSoft Pvt Ltd design such systems to automate growth reporting, track performance KPIs, and deliver visibility across every business function — from sales and marketing to product and customer success.
According to Gartner, companies using data-driven decision frameworks are three times more likely to outperform competitors in operational efficiency and revenue growth. For founders, this means data infrastructure isn’t a luxury — it’s a foundation for survival.
From Spreadsheets to AI-Driven Dashboards
Every startup begins with spreadsheets. They’re familiar, flexible, and quick to set up. But as the company scales, spreadsheets become a bottleneck — fragmented data sources, human errors, and manual reporting slow decision-making. This is where AI-driven dashboards redefine efficiency.
AI-powered analytics platforms transform static data into dynamic growth intelligence. Rather than waiting for monthly reports, founders can view live metrics such as MRR, CAC, churn rate, and retention trends — updated in real time. For growth hacking for tech startups, this shift is revolutionary: founders can test campaigns, measure ROI instantly, and adjust strategy based on accurate insights rather than gut instinct.
EmporionSoft’s approach moves beyond basic visualisation. Their advanced dashboards incorporate machine learning algorithms that predict churn risk, forecast revenue, and identify bottlenecks automatically. This proactive model transforms reactive founders into strategic operators — aligning perfectly with a startup growth hacking business strategy that thrives on agility, automation, and precision.
For instance, one EmporionSoft client integrated predictive analytics into their SaaS dashboard to identify declining engagement before churn occurred. Within three months, retention rose by 18%, proving that AI dashboards aren’t just analytical tools — they’re decision accelerators.
Tools for Tracking Startup Growth Metrics in Real Time
Modern data ecosystems rely on a powerful combination of BI tools, data warehouses, and API-driven pipelines to deliver reliable, up-to-date insights. These systems serve as the backbone of any growth engine startup, ensuring that every department operates from a single source of truth.
1. Business Intelligence (BI) Tools
Platforms like Tableau, Power BI, and Google Looker help visualise complex datasets in intuitive ways. They enable non-technical founders to interpret numbers through interactive dashboards rather than raw reports.
When integrated with cloud analytics tools and APIs, these systems enable real-time visibility into performance — a critical component of growth hacking strategies for startup success.
2. Data Pipelines and Warehouses
Behind every dashboard lies an automated data pipeline. These pipelines collect information from CRM systems, marketing platforms, and product analytics tools, then consolidate it into a central warehouse (e.g. BigQuery or Snowflake). This reduces manual reporting and ensures accuracy across metrics like conversion rate, engagement, and customer lifecycle value.
EmporionSoft’s engineering team specialises in building these scalable data pipelines, connecting diverse data sources through custom integrations. These pipelines feed into AI models that generate automated performance summaries — a feature particularly valuable for early-stage startups that lack dedicated data analysts.
3. AI and Predictive Analytics
AI enhances BI by identifying patterns humans might miss. Predictive models can anticipate revenue dips, spot rising acquisition costs, and suggest corrective actions. When coupled with intelligent automation, AI transforms analytics from reporting what happened to predicting what will happen.
EmporionSoft extends this intelligence through its AI Chatbots Integration Guide, which demonstrates how conversational AI can interpret dashboards and answer real-time data queries. This allows founders to ask, “What’s my CAC trend this quarter?” and receive instant insights — no manual lookup required.
Centralising Data for Smarter Decisions
As startups grow, they often accumulate fragmented systems — marketing analytics in one tool, sales data in another, and customer support tickets somewhere else. Without centralisation, data becomes siloed, creating blind spots that can derail strategy. The solution lies in building a unified data ecosystem, where every department draws from one trusted repository.
EmporionSoft’s data infrastructure projects focus on centralising data pipelines and visualising metrics across the organisation through AI-powered dashboards. This enables leadership teams to collaborate effectively, aligning engineering, product, and marketing efforts around measurable outcomes.
By adopting this approach, startups evolve into data-literate organisations — where every decision is backed by evidence, every experiment tracked in real time, and every opportunity quantified. This level of transparency helps attract investors, improve scalability, and ensure sustainable profitability.
Notably, TheCodeV.co.uk highlights how data centralisation supports “strategic agility” — the ability to pivot fast without losing operational consistency. Founders who harness this agility develop resilience against market fluctuations and gain a long-term competitive edge.
EmporionSoft’s Role in Data-Driven Transformation
At EmporionSoft, data-driven systems are at the heart of software innovation. The company’s expertise in automation, BI engineering, and AI architecture enables startups to implement growth-ready dashboards that go beyond traditional reporting. These systems empower founders to visualise startup growth hacking business strategies at scale — from marketing automation to investor-grade analytics.
EmporionSoft’s solutions align with accelerator programs such as the Oracle Startup Growth Accelerator, focusing on measurable growth frameworks and data transparency. By leveraging automation and AI, the firm helps startups create sustainable systems that don’t just display numbers — they tell the story of success.
Ultimately, building reliable data infrastructure is not about having more dashboards; it’s about creating a living intelligence network — one that connects strategy, performance, and innovation. For founders, this represents the evolution from tracking data to commanding growth itself.
Avoiding Vanity Metrics: Building a Culture of Meaningful Measurement in Startups
In the world of modern entrepreneurship, data has become both a blessing and a burden. Startups collect more metrics than ever — from website visits and app downloads to social followers and impressions. Yet, not all data tells the truth. When founders misinterpret these numbers or focus on the wrong ones, they risk creating an illusion of progress that masks real problems.
This is the danger of vanity metrics — figures that look impressive but lack actionable value. Understanding the difference between appearance and impact is what separates scalable startups from those that fade after early hype. As Harvard Business Review warns, “Metrics that flatter often distract from metrics that matter.”
In this section, we’ll explore how to spot vanity traps, prioritise actionable metrics, and cultivate a lean, data-centric culture that drives true startup growth and strategic clarity.
The Trap of Vanity Metrics
Vanity metrics are data points that appear positive but fail to reflect real customer value or business health. They offer emotional satisfaction but no practical guidance. Common examples include:
-
App downloads without active usage
-
Website traffic without conversions
-
Email open rates without clicks or sign-ups
-
Follower counts without engagement
Imagine a founder boasting 100,000 app installs. On the surface, that looks like traction. But if only 5% of those users log in weekly, the startup’s growth isn’t real — it’s superficial. Downloads ≠ engagement. Vanity metrics often fuel misleading optimism, encouraging premature scaling or misguided marketing spend.
This issue is especially critical in growth hacking a SaaS startup, where engagement and retention define survival. A SaaS product with a high signup rate but low activation or renewal rate is losing money with every “win.”
Founders must ask: does this metric drive behaviour or merely describe popularity? If it doesn’t inform a decision or predict future performance, it’s likely a vanity metric.
Vanity also affects team morale and investor perception. Inflated dashboards may look impressive during a pitch, but seasoned investors can see through them. They look for metrics tied to value creation — revenue per user, retention rate, LTV:CAC ratio, and churn reduction — not social proof without substance.
How to Identify Actionable Insights
Actionable metrics are data points that influence decisions and correlate directly with business outcomes. They measure progress in ways that allow teams to adapt, test hypotheses, and learn.
For example, in a lean startup growth hypothesis example, a founder might test:
“If we improve onboarding, user activation will increase by 20% within 30 days.”
To validate this hypothesis, actionable metrics such as activation rate, feature adoption, and retention rate become crucial. These numbers drive specific product or marketing actions.
By contrast, tracking “total downloads” during this test tells you nothing about whether onboarding improvements worked. It’s data, but it’s not direction.
Startups can improve their measurement discipline by following three key principles:
-
Link every metric to a business goal.
Ask: What decision will this data influence? If none, discard it. -
Segment and contextualise.
Rather than total traffic, measure qualified leads by source or conversion rate by campaign. Context turns raw data into insight. -
Automate and visualise correctly.
Use data dashboards that highlight cause-and-effect relationships rather than vanity-driven totals.
For instance, startups using analytics pipelines developed by EmporionSoft Pvt Ltd can easily distinguish engagement from exposure — turning reporting into decision science rather than data decoration.
Actionable metrics empower growth hacking for tech startups to evolve continuously. They show what works, what doesn’t, and what needs iteration. In contrast, vanity metrics fuel ego and inertia — two deadly forces in a fast-moving digital market.
Building a Lean, Data-Centric Culture
A lean, data-centric culture is not about tracking everything — it’s about tracking the right things. This approach stems from the Lean Startup methodology, where experimentation and learning take precedence over assumption and scale.
Founders should prioritise evidence over excitement, fostering a mindset where every initiative is measurable and every metric tied to a hypothesis. Whether testing new features, marketing strategies, or pricing models, teams must constantly ask: What behaviour does this metric reflect, and how can we influence it?
This disciplined culture also helps prevent technical debt — the accumulation of unvalidated assumptions and unused tools that slow down progress. To understand how such inefficiencies compound over time, explore Technical Debt Explained, which breaks down how poor system design and unmanaged data complexity hinder growth.
Ethics also plays a crucial role. In the pursuit of growth, some startups manipulate metrics — inflating engagement figures or selectively reporting KPIs. But genuine sustainability requires transparency. As discussed in Ethics in AI, responsible data practices build trust among customers, teams, and investors.
Actionable Example
Consider a mobile app startup that tracks “total screen time” as a success metric. On paper, rising screen time may suggest engagement — but what if users spend that time searching for a feature they can’t find? A shift to task completion rate and time-to-success metrics paints a clearer picture. The company can now take tangible steps — improving navigation or redesigning the UI — to boost satisfaction and retention.
This is how startups transition from data accumulation to data application — the defining trait of scalable, intelligent companies.
Beyond Numbers: Measuring What Matters
Founders often join growth hacking online courses for tech startups hoping for quick wins or secret formulas. But the truth is simpler and harder: growth comes from disciplined learning. Vanity metrics may impress in the short term, but actionable insights sustain the long term.
Startups must embrace evidence-based evolution — test hypotheses, analyse cause and effect, and pivot intelligently. This mindset distinguishes genuine innovators from noise-makers in the ever-crowded startup landscape.
By grounding decisions in validated data, teams transform growth from chance into a repeatable process. And that’s the true power behind startups and growth strategies examples seen in global success stories — clarity, honesty, and relentless learning.
Lessons from the Field: How Data-Driven Startups Achieved (and Lost) Growth Momentum
Behind every successful startup lies a pattern — a disciplined focus on measurable outcomes and actionable metrics. While creativity may spark innovation, data-driven execution fuels scale. Across industries — SaaS, hardware, and tech — founders who tracked key indicators such as CAC:LTV ratio, activation rate, and churn rate built resilient, scalable companies. Conversely, those who ignored these metrics often found themselves overwhelmed by unsustainable growth or operational chaos.
The following case studies illustrate both sides of the story — from high-growth startup success stories to sobering lessons of failure — and highlight how mastering metrics can make or break a venture.
Case Study 1: SaaS Startup’s Journey from Seed to Series A
In 2021, a SaaS-based project management startup in Europe — inspired by the likes of Asana and Notion — began its journey with a small seed round of £400,000. Like many early ventures, its initial challenge was achieving product-market fit. Rather than chasing vanity metrics like downloads or social mentions, the founders focused exclusively on activation rate, customer acquisition cost (CAC), and lifetime value (LTV).
Their growth engine centred on a clear CAC:LTV ratio target of 1:3, a benchmark often cited by Y Combinator for sustainable SaaS scaling. Every marketing campaign, feature update, and pricing change was measured against this ratio.
-
Initial Phase (Seed Round): The team used A/B testing to determine which onboarding flow improved activation. Data revealed that simplifying signup steps increased activation rate from 42% to 68%.
-
Growth Phase (Pre-Series A): Using automated dashboards built with business intelligence tools, the founders monitored churn and customer lifetime revenue in real-time. When churn rose to 6%, they implemented personalised email nudges and feature tutorials, reducing it to 3.8% within two months.
By the time they approached Series A investors, the company showcased consistent 20% month-over-month revenue growth, strong retention, and a transparent data model — securing £6.2 million in new funding.
Their story epitomises how applying the three horizons of growth for startups — short-term traction, medium-term optimisation, and long-term innovation — builds credibility and investor trust.
EmporionSoft’s own case studies reflect a similar philosophy: measurable metrics over assumptions. By helping clients visualise their performance data through smart analytics platforms, the company empowers startups to scale with clarity, not chaos.
Case Study 2: Hyper Growth Startup in Tech Industry
In 2019, a hyper growth tech startup in the logistics automation space experienced what every founder dreams of — explosive adoption. Its AI-driven tracking software gained rapid traction across the Middle East and South Asia, with customers praising its predictive route optimisation. However, unlike many companies caught off-guard by scale, this team built their operations around data-first discipline.
Their growth strategy mirrored frameworks discussed in TheCodeV.co.uk — particularly around balancing rapid scale with data sustainability. By integrating machine learning dashboards, they tracked customer retention, server uptime, and operational efficiency metrics in real time.
The leadership’s obsession with data led to several measurable results:
-
CAC dropped by 27% after automating sales qualification through AI.
-
LTV increased by 32% after implementing proactive customer support automation.
-
Retention grew consistently, fuelling compounding revenue growth.
They also embraced principles from traction how any startup can achieve explosive customer growth, focusing on small experiments that scaled fast once validated — such as pricing tier adjustments and feature gating.
What distinguished this company from others in the same space was its adaptive governance. Rather than chasing unverified metrics, they built cross-departmental dashboards, connecting finance, engineering, and marketing in one data ecosystem.
EmporionSoft’s approach to intelligent infrastructure — similar to that seen in Blockchain Beyond Crypto — reflects this strategy: use automation and analytics to ensure growth doesn’t outpace operational readiness. Today, that logistics startup operates across 18 countries and serves as a high growth startup synonym for disciplined scalability.
Learning from Failure: When Data Was Ignored
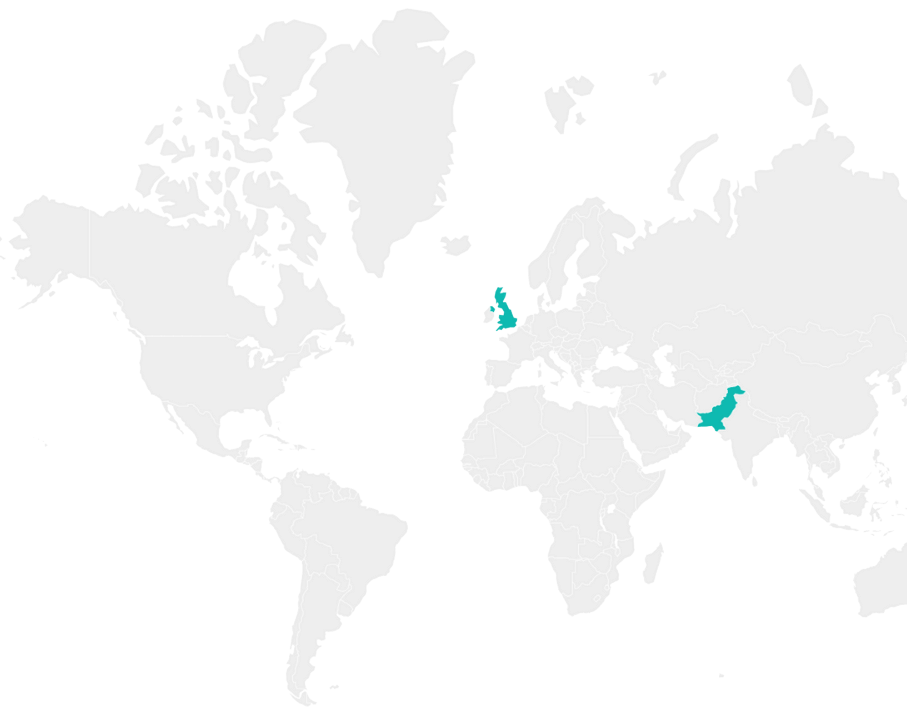
Not all stories end in success. In 2020, a Pakistani e-commerce startup — once hailed as a rising star among startups and their growth in Pakistan — collapsed within 18 months of its Series A round.
The company expanded aggressively across multiple cities, prioritising rapid GMV (gross merchandise volume) growth and flashy customer acquisition campaigns. They celebrated vanity metrics — downloads, website visitors, and social impressions — without examining whether those users translated into repeat customers or sustainable margins.
When acquisition costs skyrocketed, the lack of actionable KPIs became fatal. Churn rates rose above 15%, cash flow turned negative, and by the time the leadership realised the problem, it was too late. The business model had scaled faster than it could stabilise.
Post-analysis by TechCrunch revealed a recurring pattern among failed high-growth startups: a lack of metric literacy. Teams often celebrate temporary traction without validating true customer behaviour or profitability.
Had this company applied a lean startup hypothesis — testing, validating, and iterating with clear performance indicators — its story could have mirrored the sustainable scale seen in its regional peers.
This cautionary tale reinforces a simple truth: data ignored is opportunity lost. Founders must combine ambition with analysis, creativity with control.
Data-Driven Takeaways
Across these examples, a consistent theme emerges — data maturity defines growth maturity. Whether in SaaS or logistics, the most successful startups leverage structured analytics, unified dashboards, and hypothesis-driven experimentation to fuel long-term success.
EmporionSoft’s own journey in enabling these transformations demonstrates how data engineering and business intelligence empower founders to balance innovation with accountability. The future belongs not just to the bold, but to the measured
Conclusion: Turning Metrics into Momentum for Startup Success
Throughout this guide, we’ve seen how the most successful founders are not just visionaries — they are data strategists. They recognise that startup growth is not a product of luck or viral buzz, but of measurable insight and deliberate optimisation. By mastering key performance indicators (MRR, CAC, LTV, churn, retention, activation), they transform uncertainty into clarity and decisions into predictable progress.
When viewed through a structured analytics framework, the growth of a startup business chart becomes more than a set of lines and percentages — it becomes a story of learning, iteration, and resilience. Startups that harness data early gain a decisive advantage: they evolve faster, attract smarter funding, and build scalable systems designed to last.
According to McKinsey & Company, organisations that rely on data-driven decision-making are 23 times more likely to acquire customers and six times more likely to retain them. Similarly, Forbes reports that investor confidence rises dramatically when founders can demonstrate metric-based transparency and operational control. In other words, mastering metrics is not just about performance — it’s about perception, credibility, and long-term trust.
From Insight to Impact: The Founder’s Advantage
True growth happens when founders use insights not merely to observe but to act. Every data point — whether an uptick in retention or a dip in conversion — tells a story that can shape product evolution, pricing strategy, or marketing focus.
This is where an effective startup growth strategy transitions from numbers to narrative. Instead of reacting to market noise, founders can proactively design their company’s trajectory. They understand which levers drive engagement, what customer behaviours forecast churn, and how operational efficiency translates into profitability.
When visualised through advanced analytics and business intelligence systems, this data becomes a compass — guiding teams across departments towards a unified goal. It helps founders articulate a compelling vision to investors, align internal stakeholders, and maintain agility in rapidly changing markets.
Startups that embrace such precision-thinking stand out in every phase of development, embodying the principles behind modern startups and growth strategies: test, learn, adapt, and scale with purpose. The future belongs to those who not only collect data but interpret it wisely and act upon it decisively.
Partner with Experts to Build Your Growth Engine
Achieving data maturity requires more than dashboards — it requires a robust ecosystem that integrates automation, analytics, and intelligence. That’s where EmporionSoft Pvt Ltd becomes a partner in your growth journey.
With expertise in data analytics dashboards, BI systems, and custom growth-tracking software, EmporionSoft empowers startups to transform raw numbers into strategic advantage. Their tailored solutions centralise KPIs, automate reporting, and deliver the real-time insights you need to grow confidently.
Whether you’re an early-stage founder defining your metrics or a scaling business refining your strategy, EmporionSoft helps you turn complexity into clarity.
Explore their Consultation Page to discuss your data vision, or reach out directly via Contact Us to begin building your startup’s intelligence framework. You can also visit Our Insights to read more about the technologies shaping data-driven business innovation worldwide.
EmporionSoft: Where Data Becomes Direction
The age of instinct-driven entrepreneurship is over. The future belongs to those who see patterns in numbers and purpose in performance. By aligning your startup’s growth model with measurable intelligence, you’re not just keeping pace with change — you’re defining it.
Now is the time to evolve your vision into a data-powered reality. Partner with EmporionSoft Pvt Ltd, and together, let’s build the systems, dashboards, and strategies that turn your insights into impact — and your startup into a story of sustainable success.